
Mat Leitch is applying some mining industry-like analytics to determine the real value of the wood resource base in northwestern Ontario.
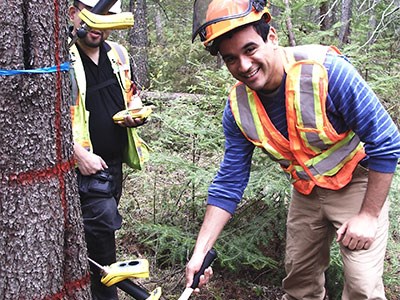
The Lakehead University associate professor and his woods sciences research team have been using an acoustics machine to bounce sound waves off trees to record their mechanical and physical properties in a digital mapping exercise that will add a new layer of intelligence to forestry planning and harvesting.
“We have no idea of the quality and the value of the wood that we have,” said Leitch. “This sort of thing will give us that very intensive knowledge that we’ve needed for a long time.”
The maps, to be released this winter, will provide a level of detail that will provide Ontario with a global edge in being able to promote the province’s wood to new value-added industry players.
“It would put us as leaders as far as knowing what we have on the landscape,” said Leitch. “Currently, we haven’t got a clue.”
Over the years, Leitch has been developing a landscape mapping program for whole-tree wood property maps for several species in the northwest.
He began by mapping the properties of underutilized species like birch, but has expanded the database to include black spruce, jack pine, tamarack, black ash and cedar.
The area surveyed is a swath of forest stretching from the Manitoba border to a point near Wawa, and north to what’s known as the Area of the Undertaking, south of the 51st parallel where commercial forestry is permitted.
The intensive maps show physical and mechanical wood properties from pith (the centre of the tree) to bark, and from the stump to the top of tree. The attributes of a tree, or an entire stand, can be displayed for hardness, elasticity and thermal values.
It also shows the volumes and dimensions of species at various elevations, the grade of wood that can be extracted, and potential wood products, among other things.
Key to his team’s findings involved mastering the nuances of a New Zealand-made acoustics machine – a non-destructive method - used to record these properties.
Leitch originally intended to release the maps this summer until he came across 3-D software which will add a new layer of detail.
“On the screen, we can rotate it to look up the middle of the tree, look at it from the outside, and we can attach all of our properties to it.”
When the project is complete, Leitch will make the maps available to industry, government agencies, and economic developers as investment attraction tool.
“If you have a company that has a high demand for select structural, we can run the query and it’ll pull up a forest that has a high percentage of that grade of lumber in it.”
Leitch’s research mirrors the kind of geoscientific work that the mining industry has done for years.
“It amazes me that our industry has not done that when you look at the investment into mills and operations, and we’re just blindly cutting trees.”
This project has been on his agenda since he first arrived on campus in the early 2000s.
Based on his international studies, Leitch knew Ontario wood couldn’t compete with tropical countries on the volume side, but Canadian trees do have their own inherent qualities that make them unique.
“The whole goal is to make us more competitive and when we use wood we use it to its highest value.”
Leitch said this kind of knowledge is something that’s been missing in the industry and should eliminate some costly harvesting and processing inefficiencies.
Too often, he said, fibre is graded at the back end of the sawmilling process.
The maps should be useful in minimizing the amount of costly inventory that builds up in mill yards and maximizes the efficiency and value of product going out the door. It will also show what’s available on the landscape before they cut down a tree.
The idea is to match value-added producers with the right quality and volume of wood they need to make specific products.
Someone told once Leitch that his maps would provide fodder for companies to “high-grade” the forest. Not so, he said. As one industry insider told him: “I need to know where the cream is and I need to know where the milk is.”
Leitch has been presenting the maps to select groups, like Canadian Wood Fibre Centre in Sault Ste. Marie, just to whet their appetites.
“We did this first study on the landscape mapping for Resolute Forest Products in a project last summer and they just loved the results that we produced.”
The maps should be an upgrade over the traditional Forest Resource Inventory surveys, which Leitch said, delineates the forest based on species and volume. “That doesn’t tell us anything about the quality.
“Now, we can optimize and saw a forest before someone even cuts the tree down, and tell them exactly the grades of wood they’re going to get, how much value there is in the whole forest product and what products are going to come out of it.
“And we can do that on a computer in our office with the data that we have.”


